-
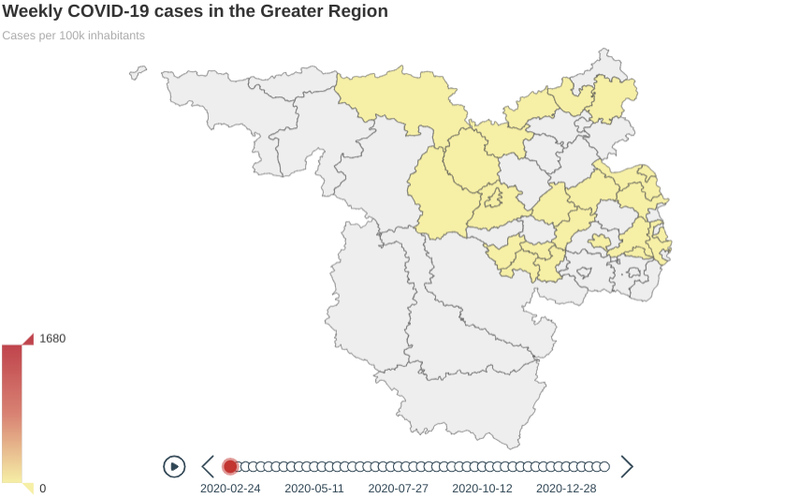
Weekly COVID-19 cases in the Greater Region
This visualisation uses open data from the regions that make up the Greater Region. Details on how I built this visualisation can be found here. -
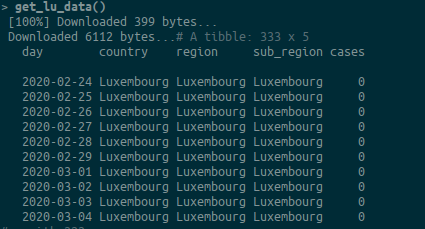
covidGrandeRegion
covidGrandeRegion This R package makes it easy to download daily or weekly COVID-19 cases data for the various regions from the Greater Region. For each of the 4 countries… -
CovidSimu
This is a dashboard made with Shiny and Dygraphs. It is hosted on shinyapps.io Source code can be found here. License is wtfpl. You can read a copy of the wtfpl here. -
michelRodange
michelRodange is a package for the R programming language which contains the three works of Michel Rodange that you can find here… -
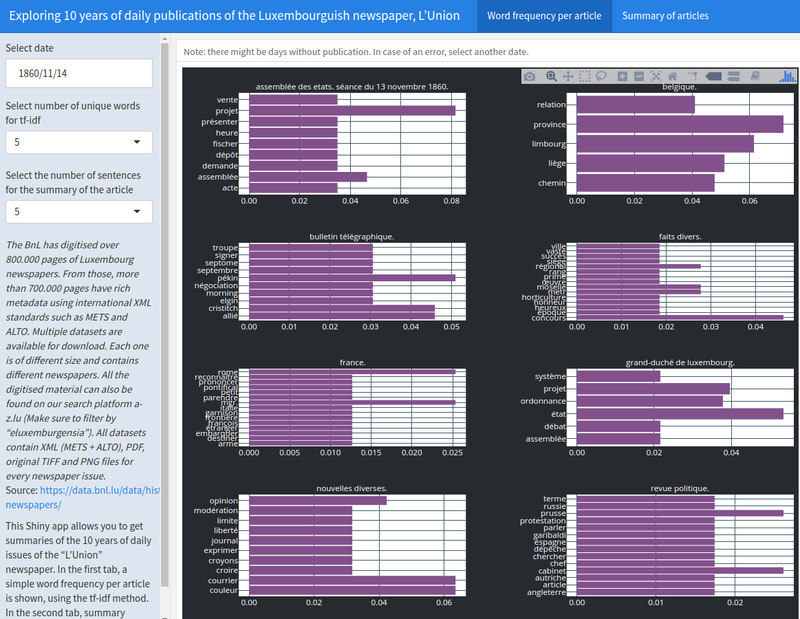
Shiny app to read 10 years of newspapers
This Shiny app allows you to get summaries of the 10 years of daily issues of the “L’Union” newspaper. In the first tab, a simple word frequency per article is shown, using the…