
Electricity map production capacity for Luxembourg
Description
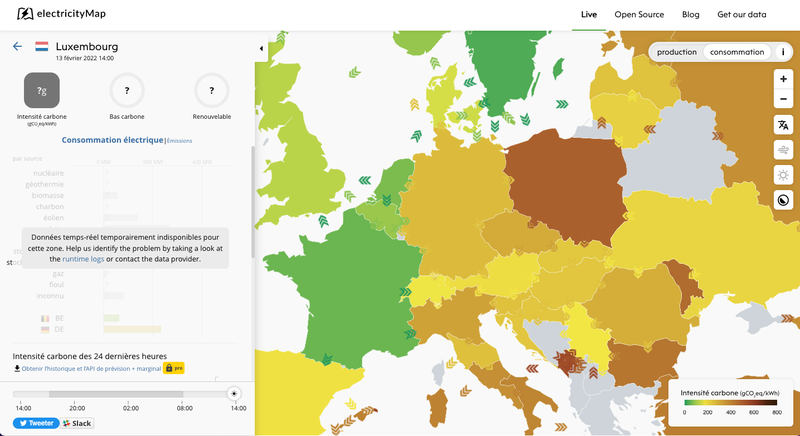
ElectricityMap is a real-time visualisation of the Greenhouse Gas (in terms of CO2 equivalent) footprint of electricity consumption built with d3.js and mapbox GL. Try it out at http://app.electricitymap.org, or download the app on Google Play or App store.
It can be difficult to see since the live production data aren't available and cannot be displayed but you can see under the "no live data" message the production capacity now being correctly display.

If I remove the message, you can see it better


One step closer to add Luxembourg on the map of the Greenhouse Gas (in terms of CO2 equivalent) footprint of electricity consumption!
Thématique
Autres
Type
Visualisation
Mots-clés
Date de création
13 février 2022
Dernière mise à jour
21 juillet 2025
0 jeu de données
Discussions
Il n'y a pas encore de discussion pour cette réutilisation.
4 réutilisations du même créateur
-
-

-

-
EU Digital COVID Certificate passbook Generator
Application
Publié le 29 juin 2021 par Thibault Milan