
Electricity map production capacity for Luxembourg
Description
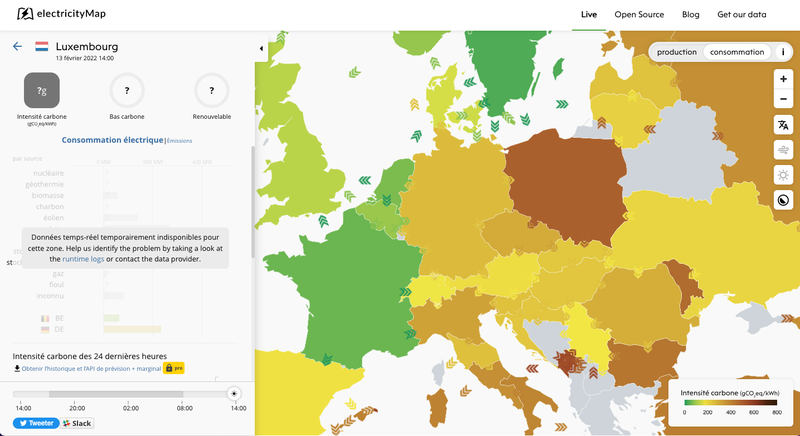
ElectricityMap is a real-time visualisation of the Greenhouse Gas (in terms of CO2 equivalent) footprint of electricity consumption built with d3.js and mapbox GL. Try it out at http://app.electricitymap.org, or download the app on Google Play or App store.
It can be difficult to see since the live production data aren't available and cannot be displayed but you can see under the "no live data" message the production capacity now being correctly display.

If I remove the message, you can see it better


One step closer to add Luxembourg on the map of the Greenhouse Gas (in terms of CO2 equivalent) footprint of electricity consumption!
Topic
Others
Type
Visualization
Tags
Creation date
February 13, 2022
Last update
July 21, 2025
0 used datasets
Discussions
There are no discussions for this reuse yet.
4 reuses from the same creator
-
-

-

-
EU Digital COVID Certificate passbook Generator
Application
Published on June 29, 2021 by Thibault Milan