


LiDAR - Projet pilote d'un relevé 3D du territoire luxembourgeois
Par Administration du cadastre et de la topographie
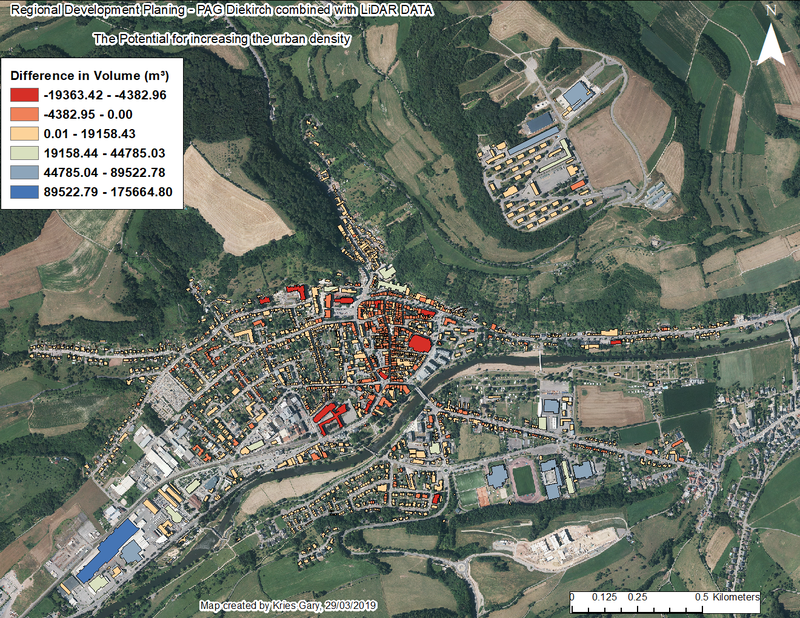
Projet pilote d’un relevé altimétrique basé sur la technologie de balayage laser aéroporté sur une surface de 10 km x 10 km autour des villes d’Ettelbrück et de Diekirch. En moyenne les points ont été mesurés avec une densité de 15 points par mètre carré et une précision horizontale de +/- 3 cm et…
Qualité des métadonnées :
Description des données renseignée
Fichiers documentés
Licence renseignée
Fréquence de mise à jour respectée
Formats de fichiers standards
Couverture temporelle non renseignée
Couverture spatiale non renseignée
Mis à jour le 21 janvier 2026
