


Combination of LiDAR data and the PAG Diekirch
Published on March 29, 2019

Gary Kries
1 reuses
Informations
- Type
- Idea
- Topic
- Others
- ID
- 5c9e2f364384b04a7f8d784b
Publication
Embed
Permalink
Description
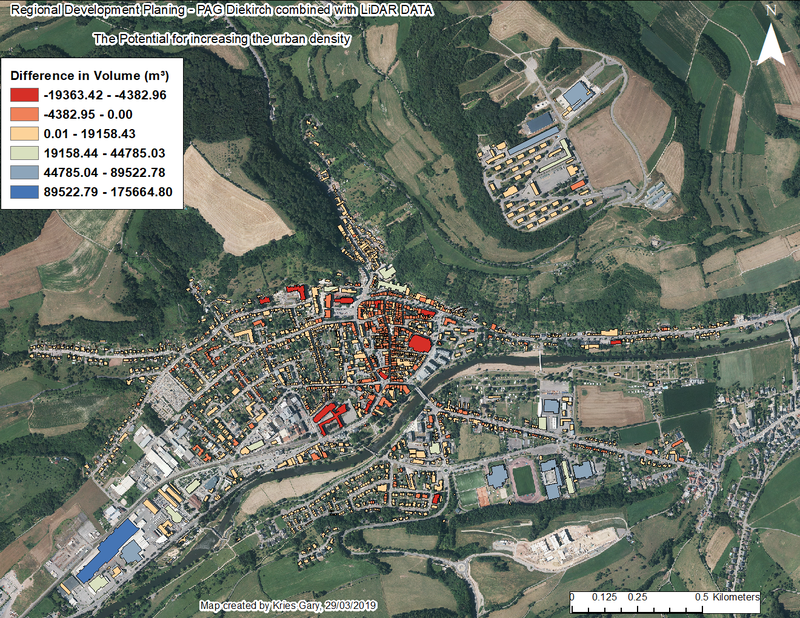
Challenge PAG Diekirch
This was a small Project I made during my internship at the „Administration du Cadastre et de la Topographie (ACT) “while with the squad of their geoportail.
The numbers for the max permitted height were extracted from the “Plan d’aménagement générale (PAG) Diekirch” published by the “Ministère de l’intérieur”. The “actual” height of the buildings got created by the use of the LiDAR data published by l’ACT. I also used the GML file contained in the data published by the "Ministère de l'intérieur".
The final result was calculated and is expressed in volume (m³) as we tried to find out how much area (x; y; z) is still available for continued urban densification. Negative values ( - ) are showing buildings that take up to much volume compared to the permitted amount, while positive values ( + ) show areas where there is still area available for later densification, given that the values in the “PAG Diekirch” do not change.
Disclaimer: There are some errors in the outcome of the project given the fact that the data was not compatible 100% and that I was only able to work for limited time on this project. For example there are buildings either missing in the shape file “Batiment” from the "Ministère de l'intérieur" that are present in the LiDAR data or the polygons for the buildings in the “Batiment” shape file are not compatible with the points defined as building in the LiDAR point cloud. Another one was the rooftops (look at the picture below). Just to name a few.
Programs used:
-QGIS
-ArcMAP (Publisher: ESRI)
-Global Mapper (for the LiDAR data) (Publisher: Blue Marble Geographics)
-FME (Publisher: Safe Software)
Used datasets 2

Discussion between the owner and the community about this reuse.
More reuses
Discover more reuses.
-
-
-
-
Chambre : les débats ont duré 122 heures
News Article
Published on August 19, 2024 by Open Data Lëtzebuerg