
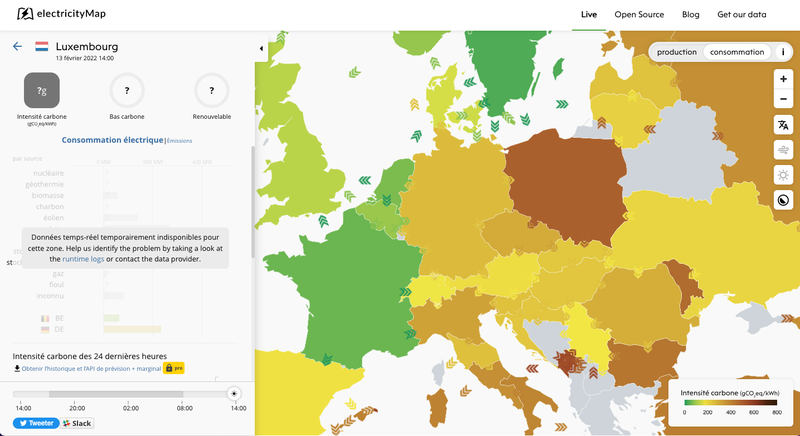
Electricity map production capacity for Luxembourg
Published on February 13, 2022

Thibault Milan
Thibault is passionate about digital culture who put his knowledge and know-how at the service of what he undertakes. He's an expert in user experience, contributed 4 years to France-Luxembourg UPA local chapter and been senior Front-end developer. Thibault is really engaged in the community…
8 datasets
3 reuses
Informations
- Type
- Visualization
- Topic
- Others
- ID
- 620921ee64d84b319e98fb00
Publication
Embed
Permalink
Description
ElectricityMap is a real-time visualisation of the Greenhouse Gas (in terms of CO2 equivalent) footprint of electricity consumption built with d3.js and mapbox GL. Try it out at http://app.electricitymap.org, or download the app on Google Play or App store.
It can be difficult to see since the live production data aren't available and cannot be displayed but you can see under the "no live data" message the production capacity now being correctly display.

If I remove the message, you can see it better


One step closer to add Luxembourg on the map of the Greenhouse Gas (in terms of CO2 equivalent) footprint of electricity consumption!
Used datasets 1
Discussion between the owner and the community about this reuse.
More reuses
Discover more reuses.
-
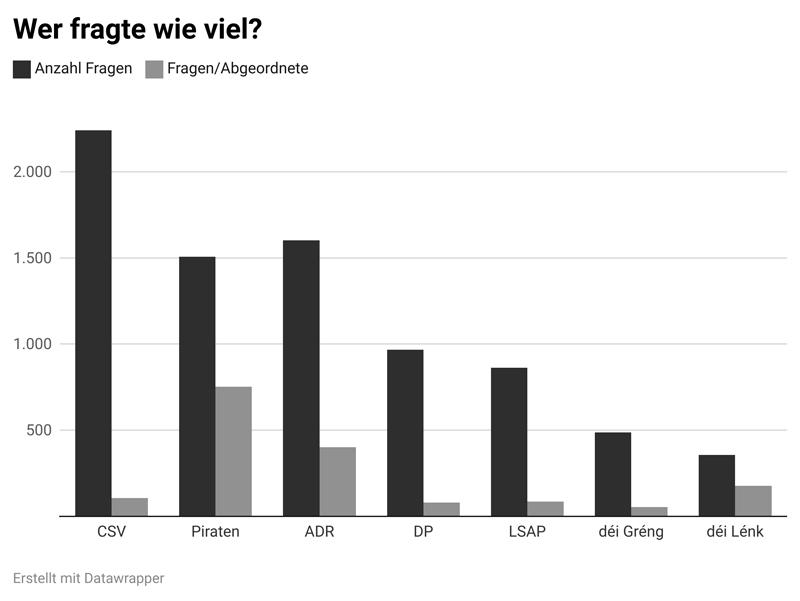
Parlamentarische Anfragen: Wieso, weshalb, warum?
News Article
Published on May 6, 2024 by Open Data Lëtzebuerg
-

-
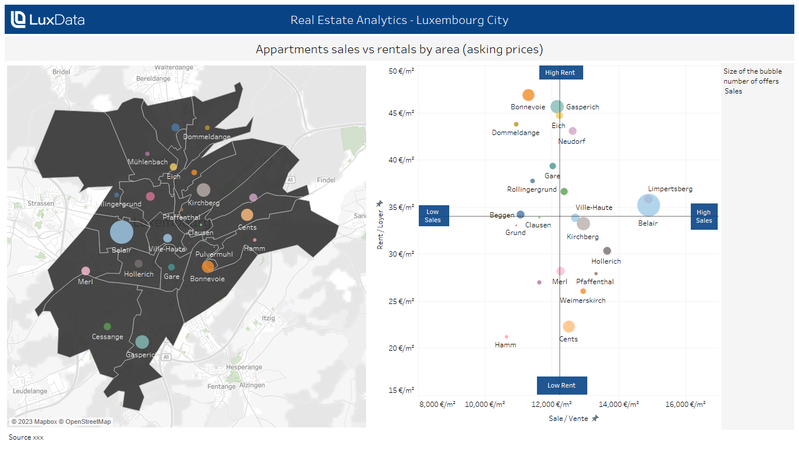
Apartment sales vs rentals by neighbourhood (asking…
Visualization
Published on April 19, 2024 by LuxData
-
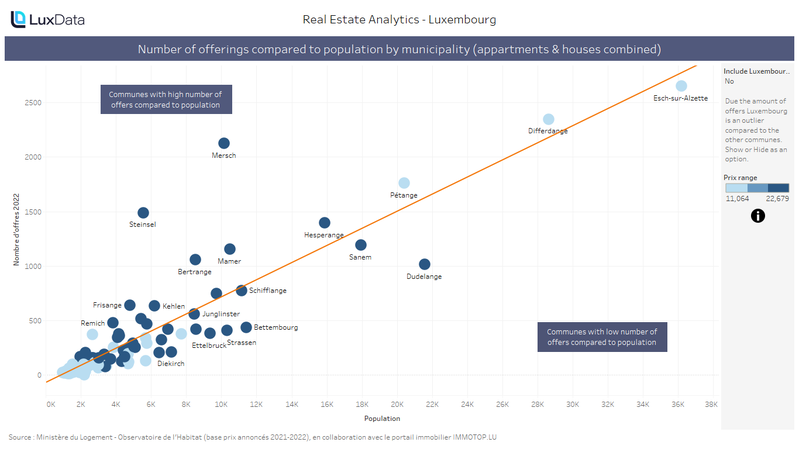
Apartments listings by municipality compared to…
Visualization
Published on April 19, 2024 by LuxData