
Air Quality - Geostatistical interpolation
Description
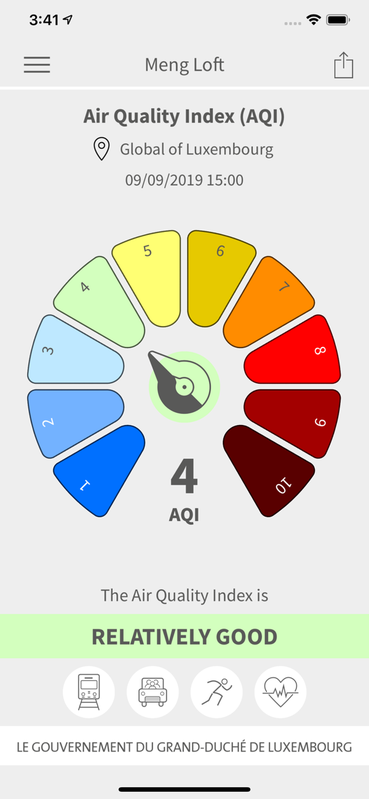
The geostatistical interpolation map shows in real time the most likely modelled distribution of the pollutant O3, NO2, PM10, or PM2.5 between the various fixed measurement points that make up the telemetric network in Luxembourg, at a spatial resolution of 1 km2.
Producer
Latest update
April 3, 2026
License
Metadata quality:
Data description filled
Files documentation missing
License filled
Update frequency followed
File formats are open
Temporal coverage not set
Spatial coverage not set
Metadata quality
Files documentation missing
Temporal coverage not set
Spatial coverage not set
1 Reuse
There are no community resources for this dataset yet.
Information
Tags
License
ID
5f8993ccfbeeaca1a6c49b00
Temporality
Creation
October 16, 2020
Frequency
Daily
Latest update
April 3, 2026